Model-based Novelty Detection
General ·- 본 포스트는 고려대학교 강필성 교수님의 2018년도 2학기 Business Analytics 강의를 바탕으로 작성되었습니다.
Novelty detection이란, 데이터에서 outlier를 잡아내는 것을 말하며, 이 글에서는 모델을 이용해 outlier를 잡아내는 것에 대해 다루고자 합니다. Novelty detection에 사용될 수 있는 대표적인 모델로는 다음과 같이 3가지를 들 수 있습니다.
- Auto-Encoder
- One-Class SVM & SVDD
- Isolation Forest
Auto-Encoder for Novelty Detection
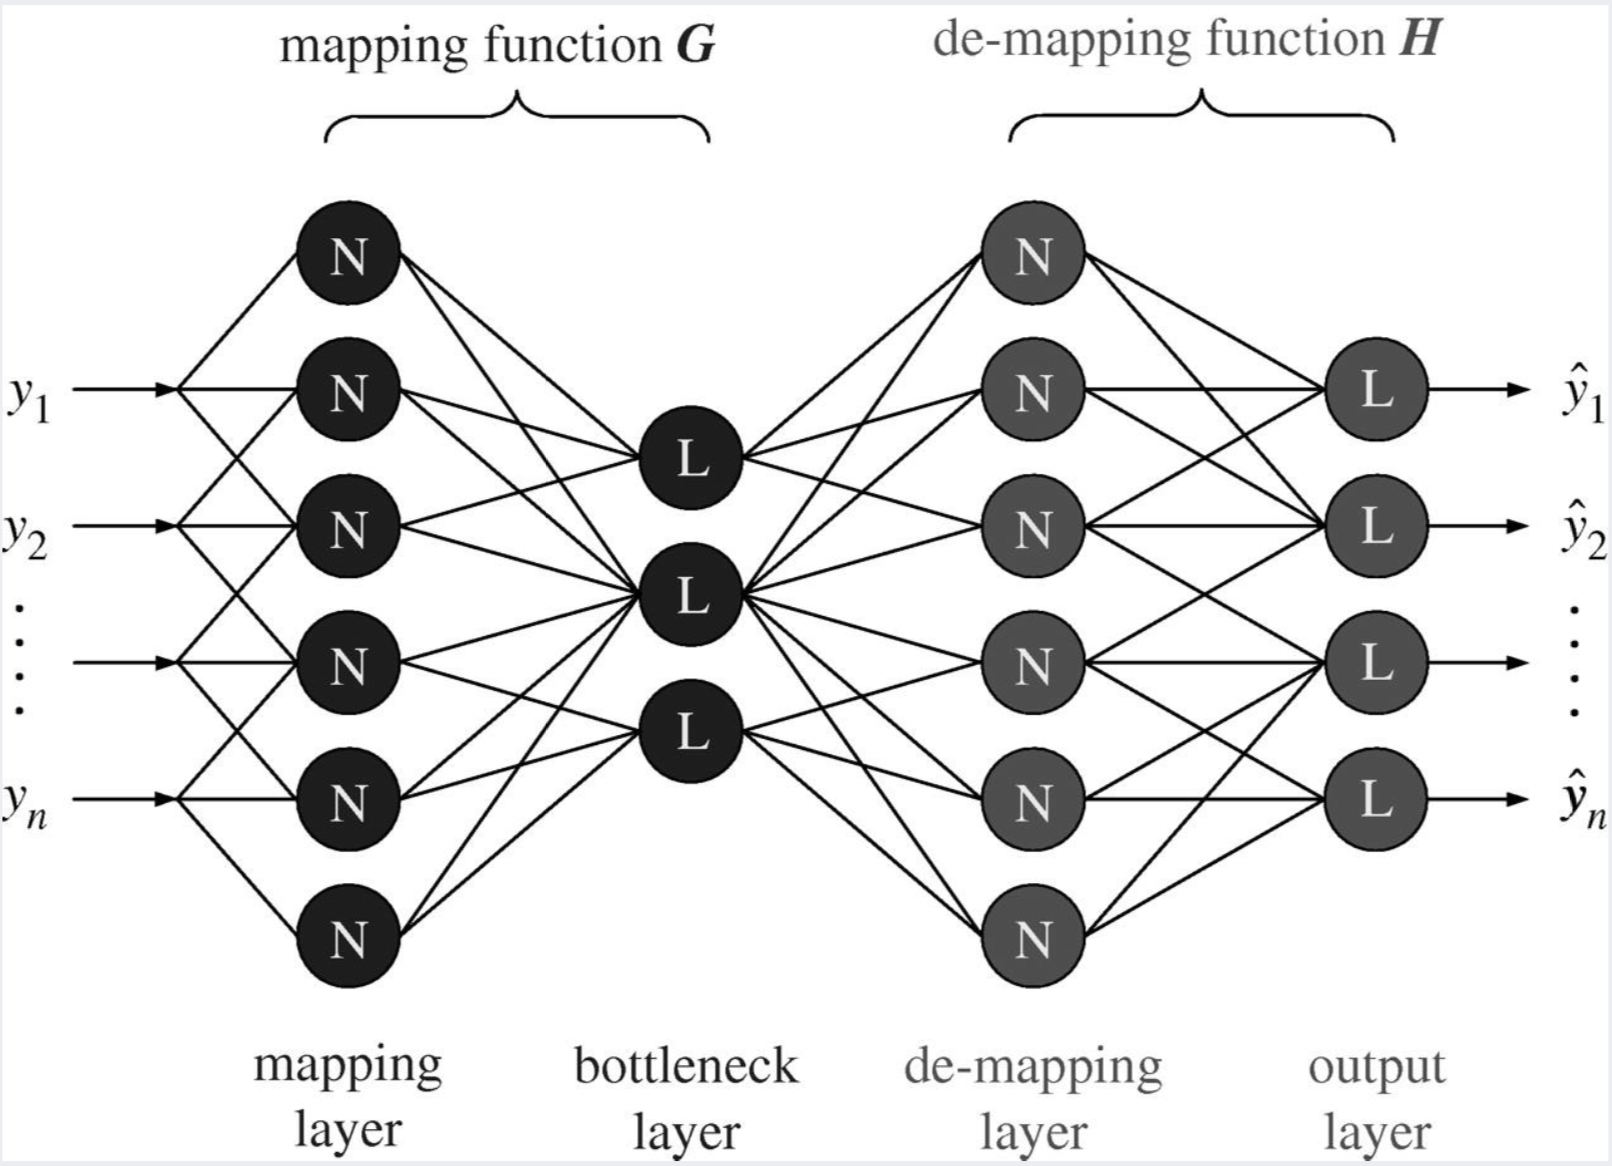
Auto-Encoder는 neural network 모델의 한 종류이며, input 데이터를 받았을 때 이와 똑같은 형태의 output 데이터를 예측하는 것을 목적으로 합니다.
Auto-Encoder의 전체적인 모델 구조는 다음 사진과 같습니다.
출처: 강필성, 2018년 2학기 Business Analytics 강의 자료 3.Novelty Detection 85쪽
Auto-Encoder는 크게 네 부분으로 나눌 수 있습니다.
- mapping layer (= encoder)
- bottleneck layer
- demapping layer (= decoder)
- output layer
Encoder에서는 input 데이터를 bottleneck layer로 보냄으로써 input 정보를 저차원으로 압축시킵니다.
Decoder에서는 압축된 형태의 input 정보를 원래의 input 데이터로 복원하는 일을 수행합니다.
앞서 언급했듯이, 이 모델의 목표는 input 데이터와 똑같은 형태의 데이터를 예측하는 것입니다.
따라서, output layer를 통해 나온 모델의 예측된 데이터와 실제 데이터의 차이를 loss function으로 정하고, 이 loss를 줄이는 방향으로 모델을 훈련시킵니다.

출처: 강필성, 2018년 2학기 Business Analytics 강의 자료 3.Novelty Detection 79쪽
Auto-Encoder의 이러한 reconstruction error는 데이터의 outlier를 잡아낼 때 사용될 수 있습니다.
즉, auto-encoder는 훈련 과정에서 훈련 데이터와 똑같은 형태의 데이터를 예측하기 위해 훈련 데이터의 일반적인 특징을 배웠을 것입니다.
그러므로, 일반적인 특징을 지닌 정상 데이터를 input으로 받았을 때는 이와 유사한 데이터를 쉽게 예측할 수 있으므로 reconstruction error가 낮은 반면,
다른 데이터와는 상이한 특징을 지닌 outlier를 input으로 받았을 때는 이와 유사한 데이터를 예측하기 어려워 reconstruction error가 높을 것입니다.
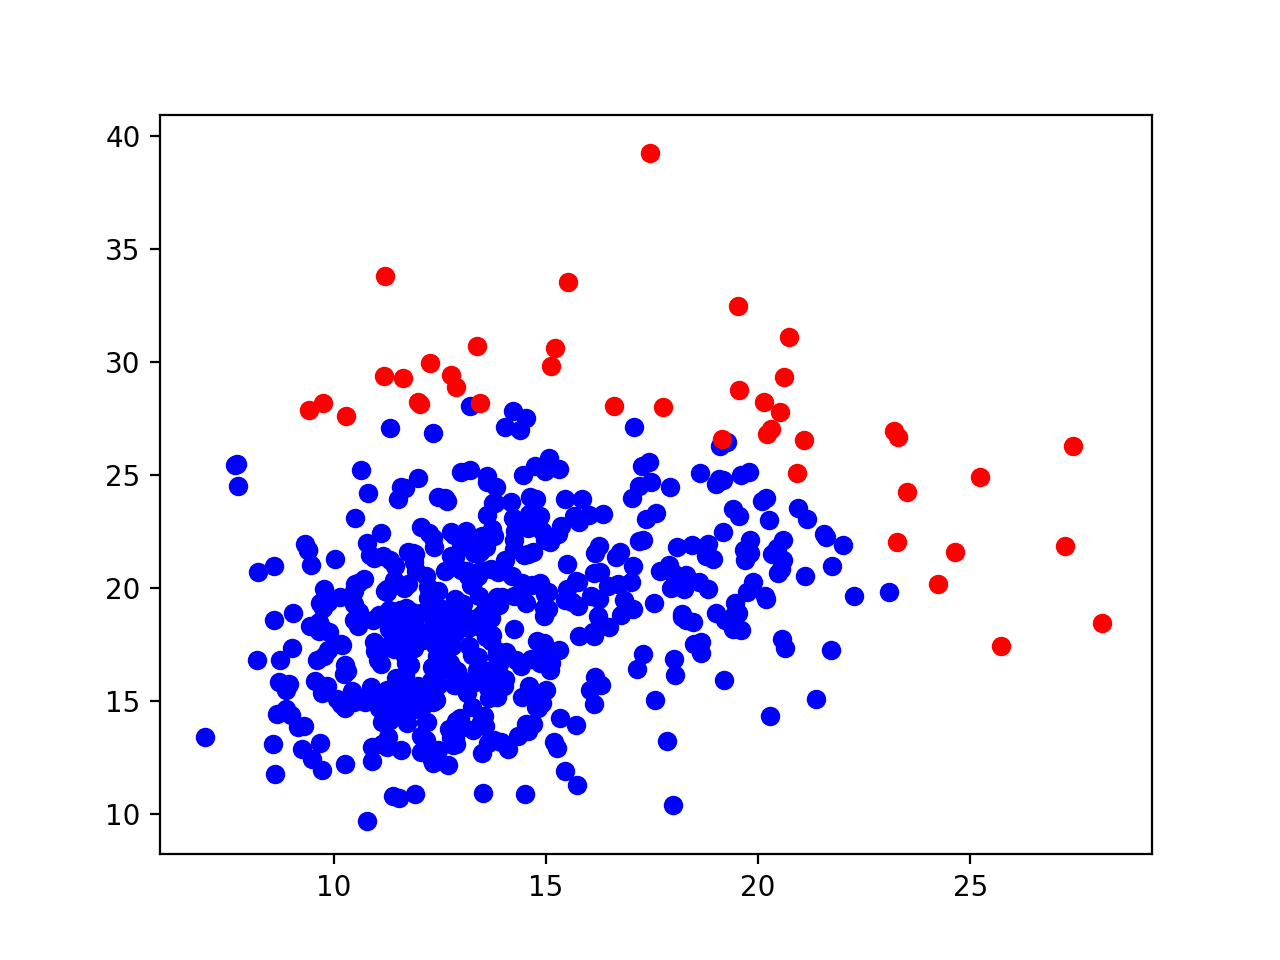
결국, reconstruction error가 특정 값보다 높은 경우에는 outlier, 그렇지 않은 경우에는 정상 데이터로 분류하는 방식으로 auto-encoder를 통한 novelty detection을 구현할 수 있습니다.
Auto-Encoder 코드
import os, sys
from matplotlib import pyplot as plt
from sklearn import datasets
import numpy as np
import tensorflow as tf


### Build auto-encoder model
class Auto_Encoder():
    def __init__(self, MODEL_DIR, mini_batch_size, learning_rate, num_epoch, num_encoder_decoder_nodes, num_latent_nodes):
        self.MODEL_DIR = os.path.abspath(MODEL_DIR)
        self.mini_batch_size = mini_batch_size
        self.learning_rate = learning_rate
        self.num_epoch = num_epoch
        self.num_encoder_decoder_nodes = num_encoder_decoder_nodes
        self.num_latent_nodes = num_latent_nodes
        # Other params
        self.weight_initializer = tf.contrib.layers.xavier_initializer()
        self.MODEL_CKPT = os.path.join(self.MODEL_DIR, "model.ckpt")
        self.each_epoch_loss = 0.0
        return

    def __prepare_data(self):
        ### Import dataset
        # Take only 2 features from original 30-dimensional data
        self.X = datasets.load_breast_cancer().data[:,:2]
        # Change dtype into float32
        self.X = self.X.astype(np.float32)

        ### Shuffle data
        np.random.shuffle(self.X)

        ### Split data into train and test set
        num_X = self.X.shape[0]
        # Use 80% of data as train set
        self.num_train_X = np.int(num_X*0.8)
        self.train_X = self.X[:self.num_train_X, :]

        ### Mini batch index
        self.mini_batch_idx = 0
        return

    def __generate_mini_batch(self):
        # Generate data with mini batch size
        if self.mini_batch_idx >= self.num_train_X:
            self.mini_batch_idx = 0
        mini_batch_X = self.train_X[self.mini_batch_idx:self.mini_batch_idx+self.mini_batch_size, :]
        self.mini_batch_idx += self.mini_batch_size
        return mini_batch_X

    def __build_model(self):
        # Input (and target)
        self.input = tf.placeholder(dtype=tf.float32, shape=[None, 2])
        # Encoder layer
        # encoder_output shape: [None, self.num_encoder_decoder_nodes]
        encoder_output = tf.layers.dense(inputs=self.input,
                                         units=self.num_encoder_decoder_nodes,
                                         kernel_initializer=self.weight_initializer)
        # Latent layer
        # latent_output shape: [None, self.num_latent_nodes]
        latent_output = tf.layers.dense(inputs=encoder_output,
                                        units=self.num_latent_nodes,
                                        activation=tf.nn.sigmoid,
                                        kernel_initializer=self.weight_initializer)
        # Decoder layer
        # decoder_output shape: [None, self.num_encoder_decoder_nodes]
        decoder_output = tf.layers.dense(inputs=latent_output,
                                         units=self.num_encoder_decoder_nodes,
                                         activation=tf.nn.sigmoid,
                                         kernel_initializer=self.weight_initializer)
        # Output layer
        # logit_shape: [None, 2]
        self.logits = tf.layers.dense(inputs=decoder_output,
                                      units=2,
                                      kernel_initializer=self.weight_initializer)
        # Loss
        self.loss = tf.losses.mean_squared_error(labels=self.input, predictions=self.logits)
        # Global step
        self.global_step = tf.train.get_or_create_global_step()
        # Optimizer
        self.optimizer = tf.train.AdamOptimizer(learning_rate=self.learning_rate).minimize(loss=self.loss, global_step=self.global_step)
        # Model saver
        self.saver = tf.train.Saver()
        return

    def train(self):
        # Create data
        self.__prepare_data()
        # Build model graph
        self.__build_model()
        # Run the model
        with tf.Session() as sess:
            # If the model exists, load it
            if tf.train.checkpoint_exists(checkpoint_prefix=self.MODEL_CKPT):
                LATEST_CKPT = tf.train.latest_checkpoint(checkpoint_dir=self.MODEL_DIR)
                self.saver.restore(sess, LATEST_CKPT)
                print('Latest checkpoint restored')
            # Create new model
            else:
                global_initializer = tf.global_variables_initializer()
                sess.run(global_initializer)
                print('New model created')
            # Train the model
            for each_epoch in range(self.num_epoch):
                for each_step in range(self.num_train_X):
                    # Get train data with mini batch size
                    mini_batch_X = self.__generate_mini_batch()
                    # Calculate loss and update the model
                    each_step_loss, _ = sess.run([self.loss, self.optimizer], feed_dict={self.input: mini_batch_X})
                    self.each_epoch_loss += each_step_loss
                print("Epoch: {}       Loss: {}".format(each_epoch+1, self.each_epoch_loss/self.num_train_X))
                self.each_epoch_loss = 0
                # Save the model every 10 epochs
                if (each_epoch+1) % 10 == 0:
                    self.saver.save(sess, self.MODEL_CKPT, global_step=self.global_step)
                    print('Model saved')
        return

    # Plot normal and novel data
    def __plot(self, predict_reconstruction_errors):
        predict_reconstruction_errors = np.array(predict_reconstruction_errors)
        # If reconstruction error is not over specific value, the data is normal
        normal_data_idx = np.where(predict_reconstruction_errors <= 45)
        # If reconstruction error is over specific value, the data is novel
        abnormal_data_idx = np.where(predict_reconstruction_errors > 45)
        normal_data = self.X[normal_data_idx]
        abnormal_data = self.X[abnormal_data_idx]
        plt.scatter(normal_data[:, 0], normal_data[:,1], c='b')
        plt.scatter(abnormal_data[:, 0], abnormal_data[:, 1], c='r')
        plt.show()
        return

    def predict(self):
        # Create data
        self.__prepare_data()
        # Build model graph
        self.__build_model()
        # Run the model
        with tf.Session() as sess:
            # Dummy list
            predict_reconstruction_errors = []
            # Load model
            LATEST_CKPT = tf.train.latest_checkpoint(checkpoint_dir=self.MODEL_DIR)
            self.saver.restore(sess, LATEST_CKPT)
            print('Latest checkpoint restored')
            # Test model
            for each_step in range(self.X.shape[0]):
                each_step_loss = sess.run(self.loss, feed_dict={self.input: self.X[each_step, :].reshape(-1, 2)})
                predict_reconstruction_errors.append(each_step_loss)
        # Plot the result
        self.__plot(predict_reconstruction_errors)
        return

# Load trained model and detect novel data
auto_encoder = Auto_Encoder('./model', 32, 0.01, 50, 500, 100)
auto_encoder.predict()
Auto-Encoder로 novelty detection을 한 결과는 다음과 같습니다.
One-class Support Vector Machine
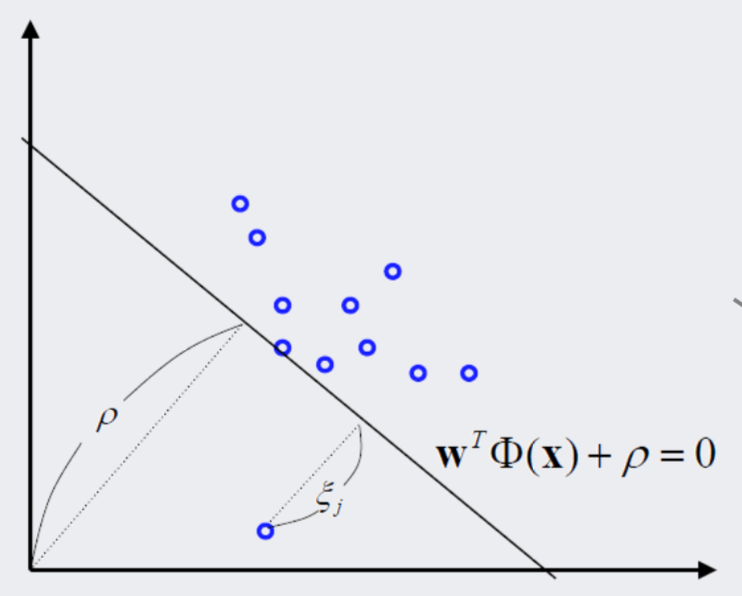
One-class SVM은 다음 사진처럼 원점으로부터 정상 데이터를 최대한 떨어져 있도록 하는 hyperplane을 찾는 SVM입니다.
이에 따라, hyperplane 아래에 위치하면서 원점과 가까운 데이터는 outlier, hyperplane 위에 있는 데이터는 정상 데이터가 됩니다.
출처: 강필성, 2018년 2학기 Business Analytics 강의 자료 3.Novelty Detection 87쪽
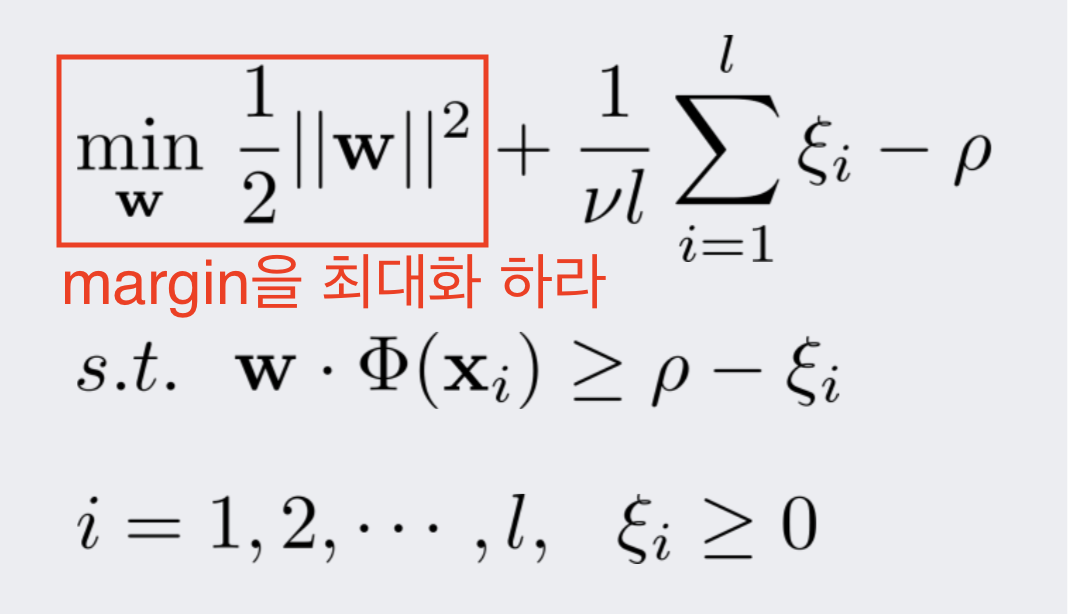
One-class SVM의 수식은 다음과 같습니다.
우선, SVM인만큼 margin을 최대화하는 기본적인 골조를 지닙니다.
출처: 강필성, 2018년 2학기 Business Analytics 강의 자료 3.Novelty Detection 88쪽
그러나 단순히 margin을 최대화할 경우, decision boundary가 원점에서부터 음 혹은 양의 방향으로 무한하게 발산할 것입니다.
이를 해결하기 위하여, 다음 사진과 같이 decision boundary가 원점으로부터 양의 방향으로 최대한 멀어지라는 제약을 더해줍니다.
이렇게 하면 음의 방향으로 발산하는 문제는 해결할 수 있지만 여전히 decision boundary가 양의 방향으로 무한하게 발산할 가능성이 존재합니다.
즉, 첫 번째 사진에서 오른쪽 위로 무한하게 움직여 모든 데이터를 decision boundary 아래에 둘 가능성이 있다는 것입니다.
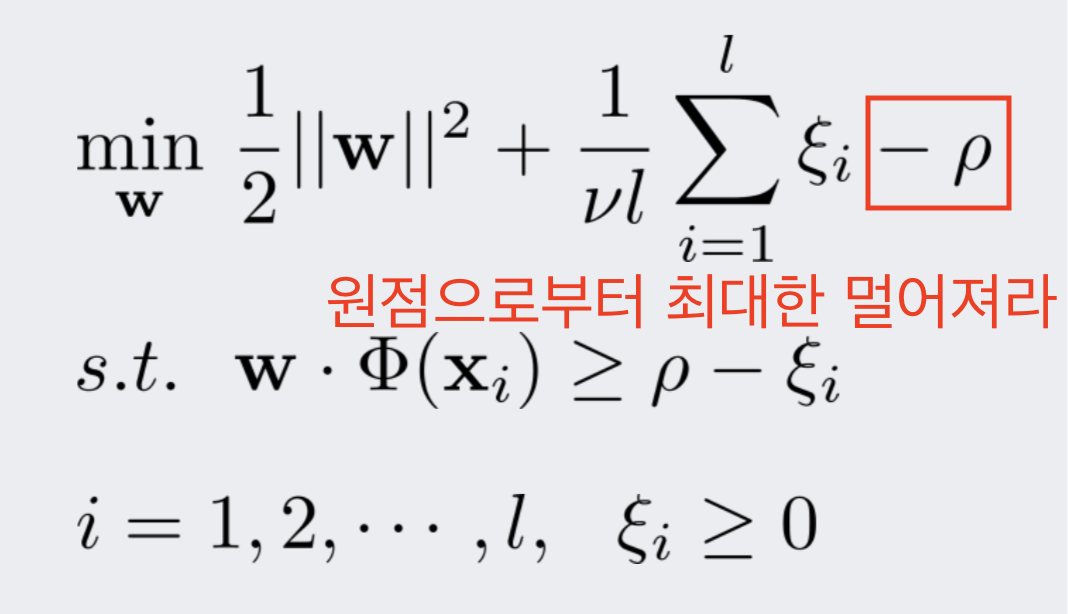
출처: 강필성, 2018년 2학기 Business Analytics 강의 자료 3.Novelty Detection 88쪽
이를 해결하기 위해, decision boundary 아래에 존재하는 샘플들에게 패널티를 가하고, 이 패널티가 최소화되도록 제약을 추가합니다.
이 제약을 통해 모든 데이터를 decision boundary 아래에 두게 되는 상황을 방지할 수 있습니다.
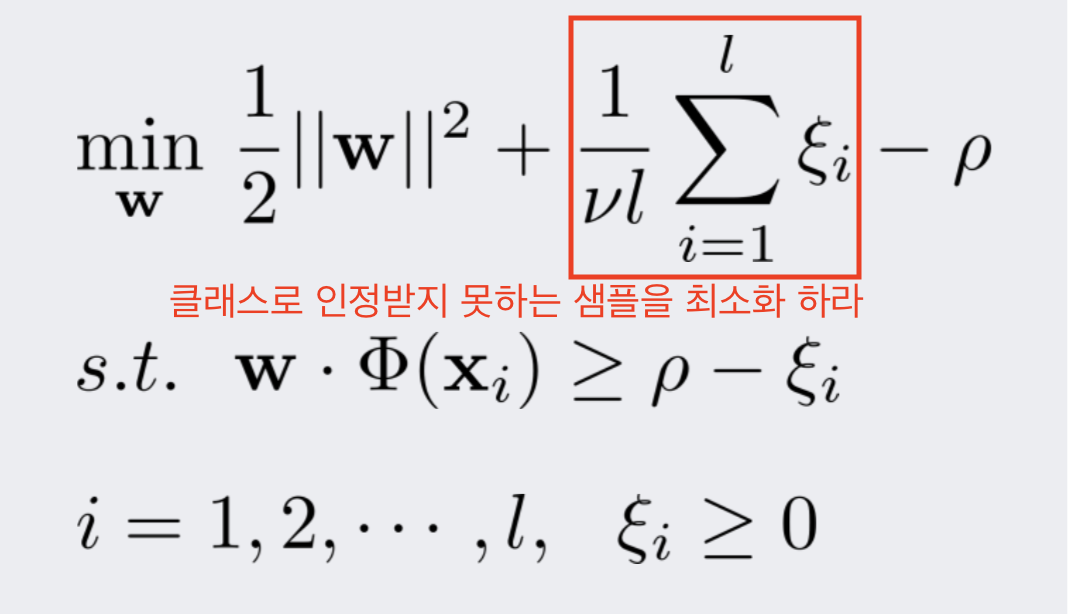
출처: 강필성, 2018년 2학기 Business Analytics 강의 자료 3.Novelty Detection 88쪽
마지막으로, 라그랑제 제약 조건을 건 후, KKT 조건을 풉니다.
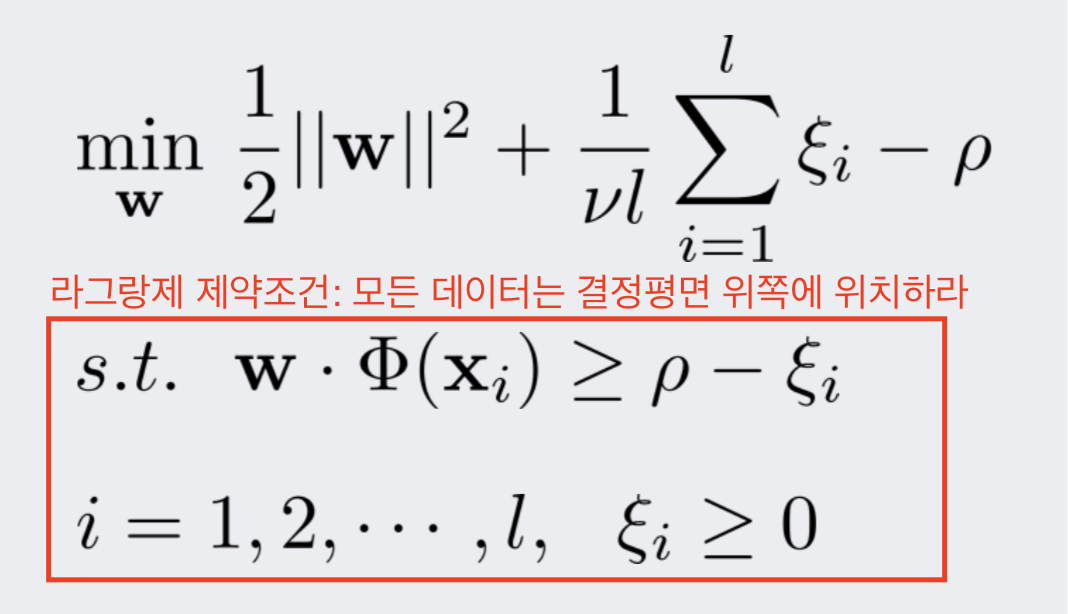
출처: 강필성, 2018년 2학기 Business Analytics 강의 자료 3.Novelty Detection 88쪽
그러면 다음과 같은 최적화 문제로 수렴됩니다.
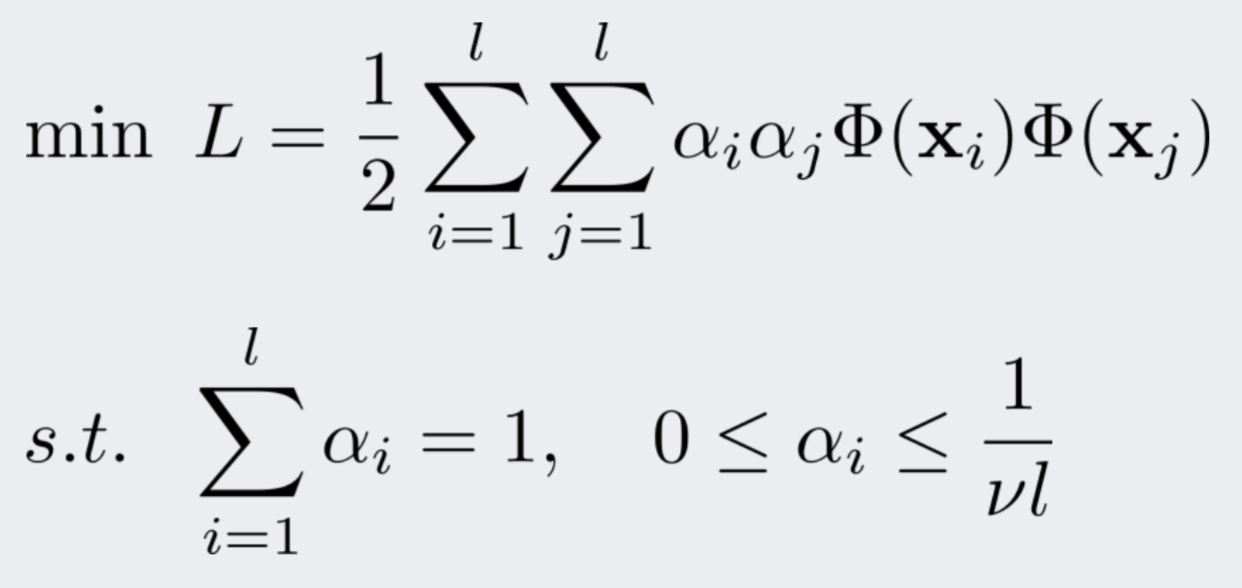
출처: 강필성, 2018년 2학기 Business Analytics 강의 자료 3.Novelty Detection 90쪽
또한, 내적의 특성을 이용하여 kernel trick을 사용할 수도 있는데, 다차원 공간 매핑을 가능하게 해주는 대표적인 커널은 다음과 같습니다.
- Polynomial kernel
- MLP kernel
- RBF (gaussian) kernel
Support Vector Data Description
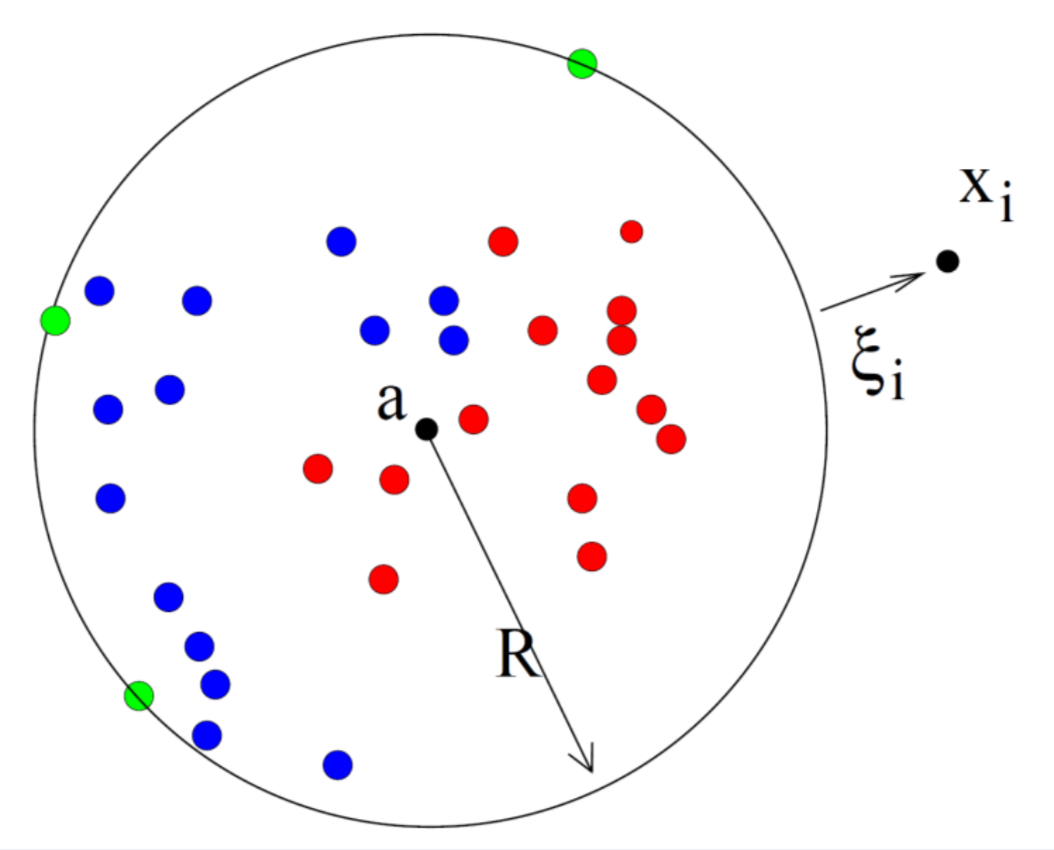
SVDD는 다음 사진처럼 정상 데이터를 감싸안을 수 있는 최소 크기의 hypersphere를 찾는 SVM입니다.
이에 따라, hypersphere 밖에 있는 데이터는 outlier, hypersphere 안에 있는 데이터는 정상 데이터가 됩니다.
출처: 강필성, 2018년 2학기 Business Analytics 강의 자료 3.Novelty Detection 94쪽
SVDD의 수식은 다음과 같습니다.
margin 대신 원의 크기(반지름)를 최소화하는 기본적인 골조를 지닙니다.

출처: 강필성, 2018년 2학기 Business Analytics 강의 자료 3.Novelty Detection 95쪽
그러나 단순히 원의 크기를 최소화할 경우, decision boundary가 작은 한 점으로 무한히 수렴해 버리고 말 것입니다.
이를 해결하기 위하여, 다음 사진과 같이 decision boundary 밖에 존재하는 샘플들에게 패널티를 가하고, 이 패널티가 최소화되도록 제약을 추가합니다.
이 제약을 통해 모든 데이터를 decision boundary 밖에 두는 상황을 방지할 수 있습니다.

출처: 강필성, 2018년 2학기 Business Analytics 강의 자료 3.Novelty Detection 95쪽
마지막으로, 라그랑제 제약조건을 건 후, KKT 조건을 풉니다.

출처: 강필성, 2018년 2학기 Business Analytics 강의 자료 3.Novelty Detection 95쪽
그러면 다음과 같은 최적화 문제로 수렴됩니다.

출처: 강필성, 2018년 2학기 Business Analytics 강의 자료 3.Novelty Detection 98쪽
또한, 내적의 특성을 이용하여 kernel trick을 사용할 수도 있는데, 다차원 공간 매핑을 가능하게 해주는 대표적인 커널은 One-class SVM에서처럼 다음과 같습니다.
- Polynomial kernel
- MLP kernel
- RBF (gaussian) kernel
One-class SVM & SVDD 코드
from matplotlib import pyplot as plt
from sklearn import datasets
from sklearn.svm import OneClassSVM
import numpy as np

class One_class_SVM():
    def __init__(self, nu, kernel, gamma):
        self.nu = nu
        self.kernel = kernel
        self.gamma = gamma
        return

    def __prepare_data(self):
        ### Import dataset
        # Take only 2 features from original 30-dimensional data
        self.X = datasets.load_breast_cancer().data[:,:2]
        # Change dtype into float32
        self.X = self.X.astype(np.float32)

        ### Shuffle data
        np.random.shuffle(self.X)

        ### Split data into train and test set
        num_X = self.X.shape[0]
        # Use 80% of data as train set
        num_train_X = np.int(num_X*0.8)
        self.train_X = self.X[:num_train_X, :]
        return

    # Plot normal and novel data
    def __plot(self, predicted_X, x_coordinates, y_coordinates, anomaly_scores):
        normal_data_idx = np.where(predicted_X == 1)
        abnormal_data_idx = np.where(predicted_X == -1)
        normal_data = self.X[normal_data_idx]
        abnormal_data = self.X[abnormal_data_idx]
        plt.contour(x_coordinates.reshape([50, 50]), y_coordinates.reshape([50, 50]), anomaly_scores.reshape([50, 50]), levels=[0], colors='red')
        plt.contourf(x_coordinates.reshape([50, 50]), y_coordinates.reshape([50, 50]), anomaly_scores.reshape([50, 50]))
        plt.scatter(normal_data[:, 0], normal_data[:, 1], c='b')
        plt.scatter(abnormal_data[:, 0], abnormal_data[:, 1], c='r')
        plt.show()
        return

    def run(self):
        # Create data
        self.__prepare_data()
        one_class_svm = OneClassSVM(nu=self.nu, kernel=self.kernel, gamma=self.gamma)
        # Fit SVM
        one_class_svm.fit(self.train_X)
        # Predict
        predicted_X = one_class_svm.predict(self.X)
        max_X_1 = np.amax(self.X[:, 0])
        min_X_1 = np.amin(self.X[:, 0])
        max_X_2 = np.amax(self.X[:, 1])
        min_X_2 = np.amin(self.X[:, 1])
        x_coordinates = np.tile(np.linspace(min_X_1, max_X_1, 50), 50)
        y_coordinates = np.repeat(np.linspace(min_X_2, max_X_2, 50), 50)
        anomaly_scores = one_class_svm.decision_function(np.c_[x_coordinates, y_coordinates])
        # Plot the result
        self.__plot(predicted_X, x_coordinates, y_coordinates, anomaly_scores)
        return

### Detect novel data
# one class SVM using polynomial
one_class_svm = One_class_SVM(0.1, "poly", 0.00001)
one_class_svm.run()
# SVDD
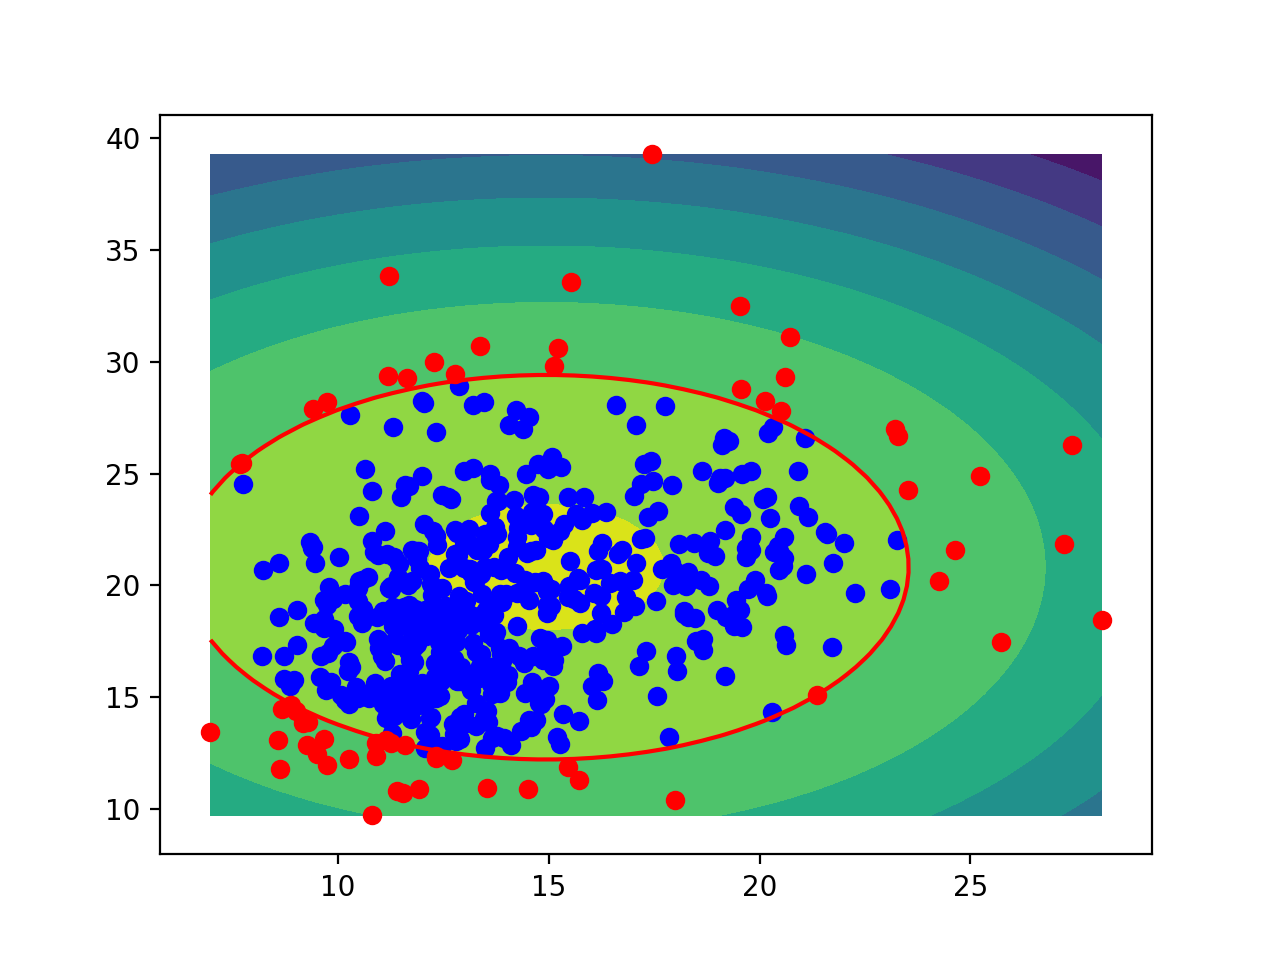
# RBF kernel을 사용할 경우, one class SVM과 SVDD는 동일한 문제(식)를 해결하게 된다고 합니다. (Ghafoori et al., 2016)
svdd = One_class_SVM(0.1, "rbf", 0.00001)
svdd.run()
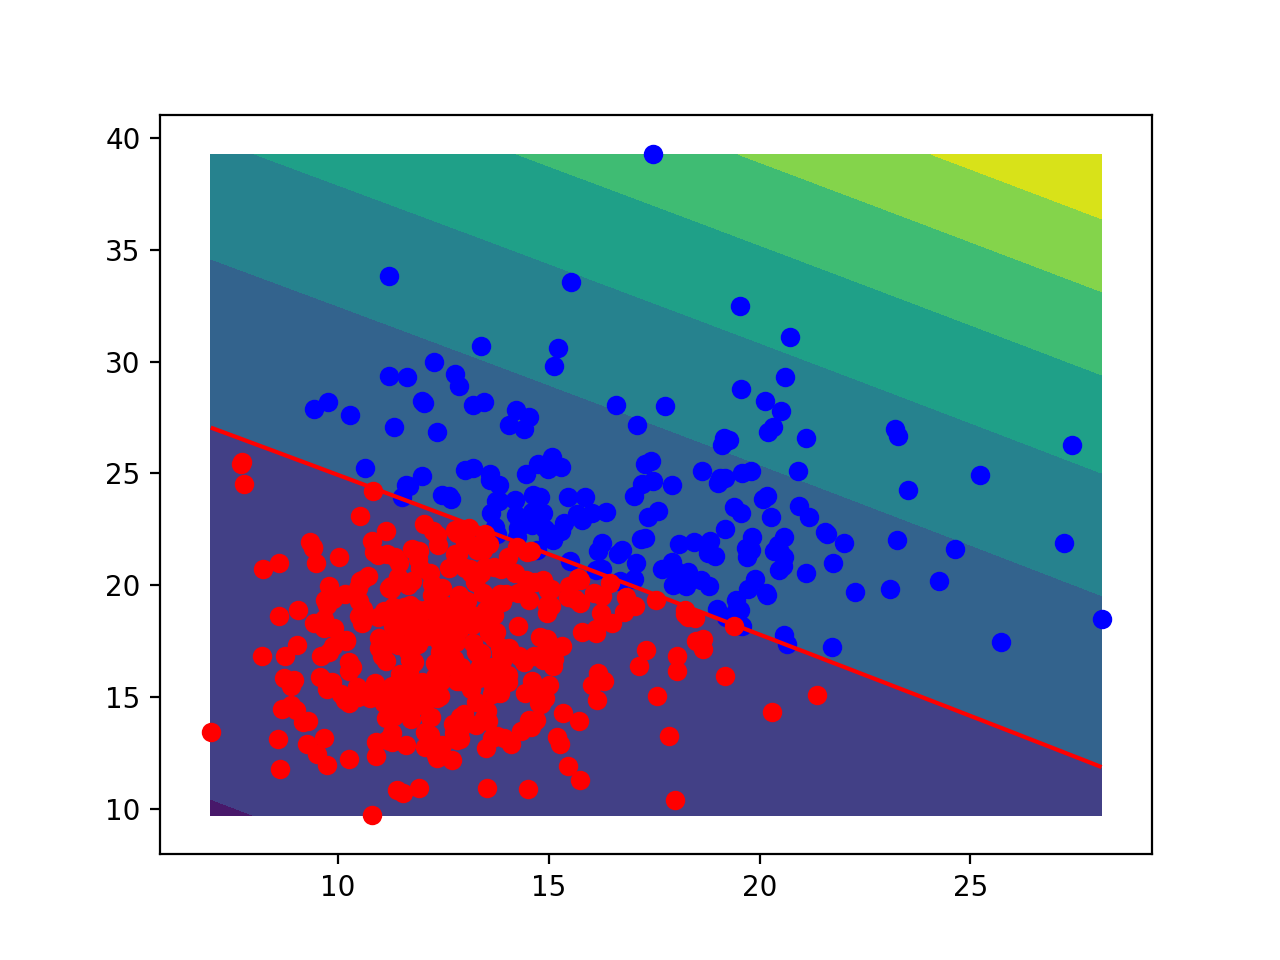
polynomial kernel을 사용한 One-class SVM으로 novelty detection을 한 결과는 다음과 같습니다.
RBF kernel을 사용한 SVDD로 novelty detection을 한 결과는 다음과 같습니다.
Isolation Forest
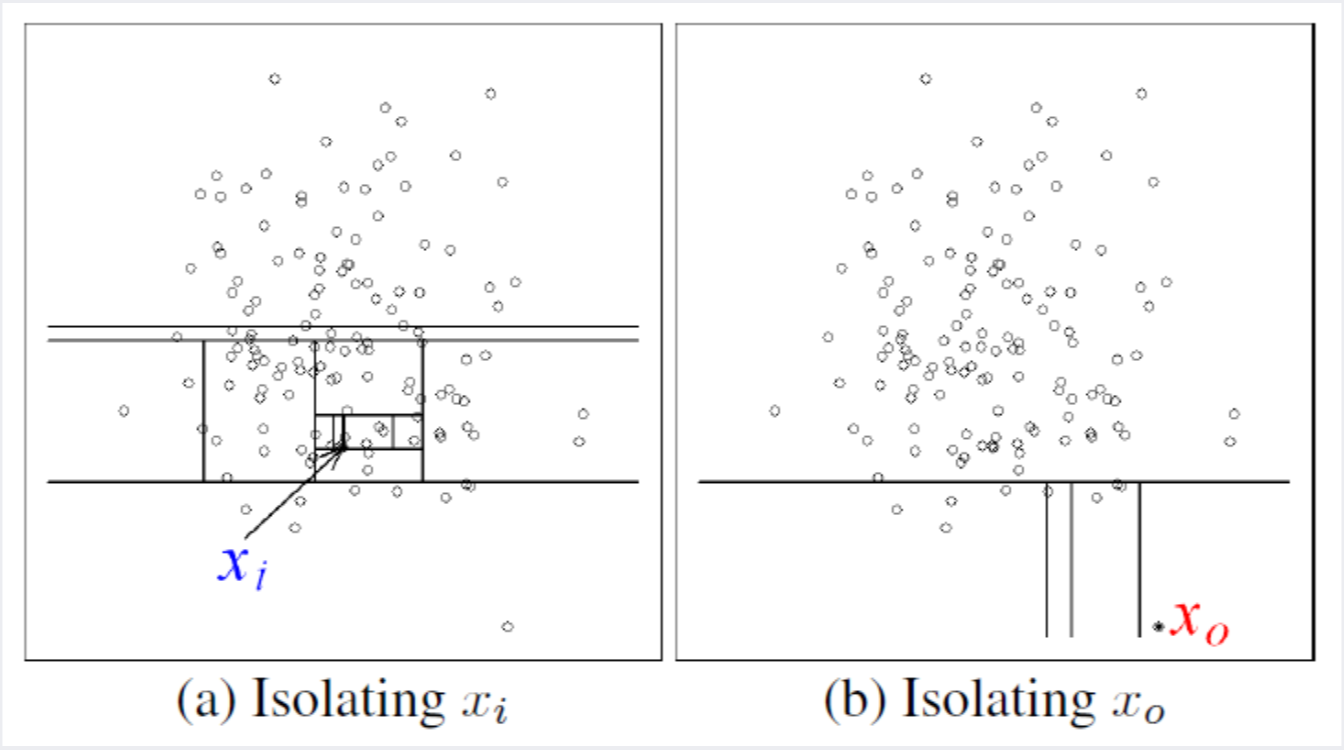
Isolation tree는 주어진 데이터를 다른 데이터와 분리하는 과정을 통해 정상 데이터와 outlier를 분리합니다.
한 데이터를 다른 데이터로부터 분리하는 방법으로는 그 데이터와 나머지 데이터 사이에 선(split)을 긋는 방식을 사용합니다.
다음 사진의 왼쪽에 있는 정상 데이터의 경우, 다른 데이터들과 뭉쳐 있기 때문에, 다른 데이터들로부터 분리(isolate)시키기 위해서는 선을 여러 번 그어야 합니다.
반면, 사진의 오른쪽에 있는 비정상 데이터의 경우, 다른 데이터들로부터 떨어져 있기 때문에, 적은 개수의 선을 이용하여 분리시킬 수 있습니다.
결국, 한 데이터를 홀로 분리시키는 데 사용되는 선의 개수가 많을수록 정상 데이터에 가깝고,
사용되는 선의 개수가 적을수록 outlier에 가까워집니다.
출처: 강필성, 2018년 2학기 Business Analytics 강의 자료 3.Novelty Detection 103쪽
이렇게 각각의 데이터를 다른 데이터들로부터 분리시키는 과정은 하나의 isolation tree로 표현할 수 있습니다.
그리고 이 분리 과정을 랜덤하게 여러 번 반복하면 isolation forest가 됩니다.
이 때, 여러 번의 랜덤한 분리 과정에서 꾸준히 적은 선으로 분리되는 데이터는 outlier로 분류되고,
꾸준히 많은 선으로 분리되는 데이터는 정상 데이터로 분류됩니다.
즉, tree의 root에서 데이터의 terminal node까지의 평균 거리(= 분리하는 데 사용되는 선의 평균 개수)가 novelty score를 계산하는 데 사용이 됩니다.
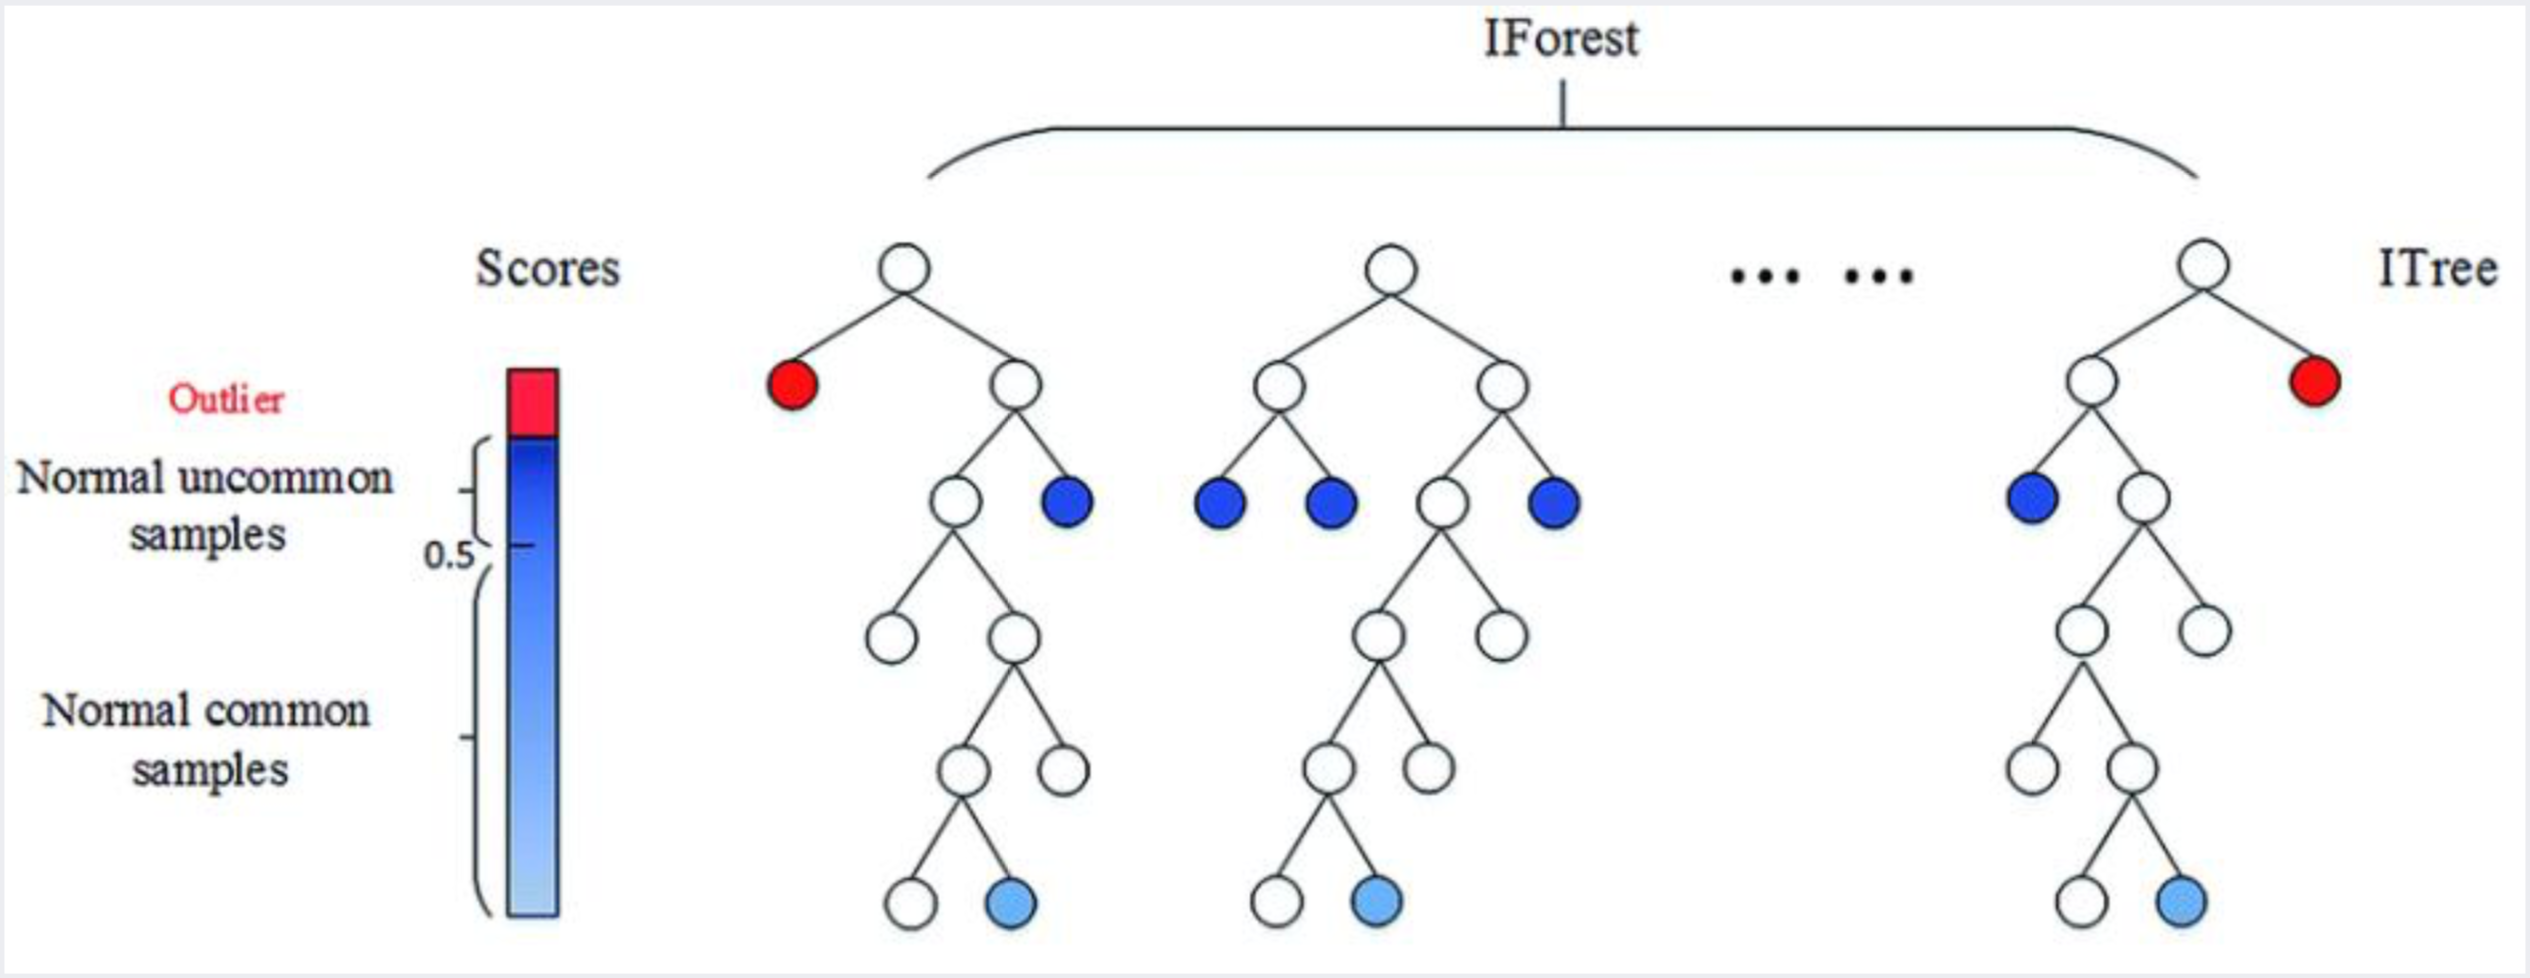
출처: 강필성, 2018년 2학기 Business Analytics 강의 자료 3.Novelty Detection 104쪽
Isolation forest에서의 novelty score은 다음과 같습니다.
E(h(x))는 isolation forest에서의 데이터 x의 평균 거리를 나타냅니다.
결국, 선이 많이 필요한 정상 데이터의 경우 E(h(x))값이 높으며, 전체 novelty score은 낮아집니다.
반대로 선이 적게 필요한 outlier의 경우 E(h(x))값이 낮으며, 전체 novelty score은 높아집니다.

출처: 강필성, 2018년 2학기 Business Analytics 강의 자료 3.Novelty Detection 106쪽
Isolation Forest 코드
import os, sys
from matplotlib import pyplot as plt
from sklearn import datasets
from sklearn.ensemble import IsolationForest
import numpy as np
import ipdb as pdb


class Isolation_forest():
    def __init__(self, max_samples):
        self.max_samples = max_samples
        return

    def __prepare_data(self):
        ### Import dataset
        # Take only 2 features from original 30-dimensional data
        self.X = datasets.load_breast_cancer().data[:,:2]
        # Change dtype into float32
        self.X = self.X.astype(np.float32)

        ### Shuffle data
        np.random.shuffle(self.X)

        ### Split data into train and test set
        num_X = self.X.shape[0]
        # Use 80% of data as train set
        num_train_X = np.int(num_X*0.8)
        self.train_X = self.X[:num_train_X, :]
        return

    # Plot normal and novel data
    def __plot(self, predicted_X, x_coordinates, y_coordinates, anomaly_scores):
        normal_data_idx = np.where(predicted_X == 1)
        abnormal_data_idx = np.where(predicted_X == -1)
        normal_data = self.X[normal_data_idx]
        abnormal_data = self.X[abnormal_data_idx]
        plt.contour(x_coordinates.reshape([50, 50]), y_coordinates.reshape([50, 50]), anomaly_scores.reshape([50, 50]), levels=[0], colors='red')
        plt.contourf(x_coordinates.reshape([50, 50]), y_coordinates.reshape([50, 50]), anomaly_scores.reshape([50, 50]))
        plt.scatter(normal_data[:, 0], normal_data[:, 1], c='b')
        plt.scatter(abnormal_data[:, 0], abnormal_data[:, 1], c='r')
        plt.show()
        return

    def run(self):
        # Create data
        self.__prepare_data()
        isolation_forest = IsolationForest(max_samples=self.max_samples)
        # Fit isolation forest
        isolation_forest.fit(self.train_X)
        # Predict
        predicted_X = isolation_forest.predict(self.X)
        max_X_1 = np.amax(self.X[:, 0])
        min_X_1 = np.amin(self.X[:, 0])
        max_X_2 = np.amax(self.X[:, 1])
        min_X_2 = np.amin(self.X[:, 1])
        x_coordinates = np.tile(np.linspace(min_X_1, max_X_1, 50), 50)
        y_coordinates = np.repeat(np.linspace(min_X_2, max_X_2, 50), 50)
        anomaly_scores = isolation_forest.decision_function(np.c_[x_coordinates, y_coordinates])
        # Plot the result
        self.__plot(predicted_X, x_coordinates, y_coordinates, anomaly_scores)
        return

# Detect novel data
isolation_forest = Isolation_forest(100)
isolation_forest.run()
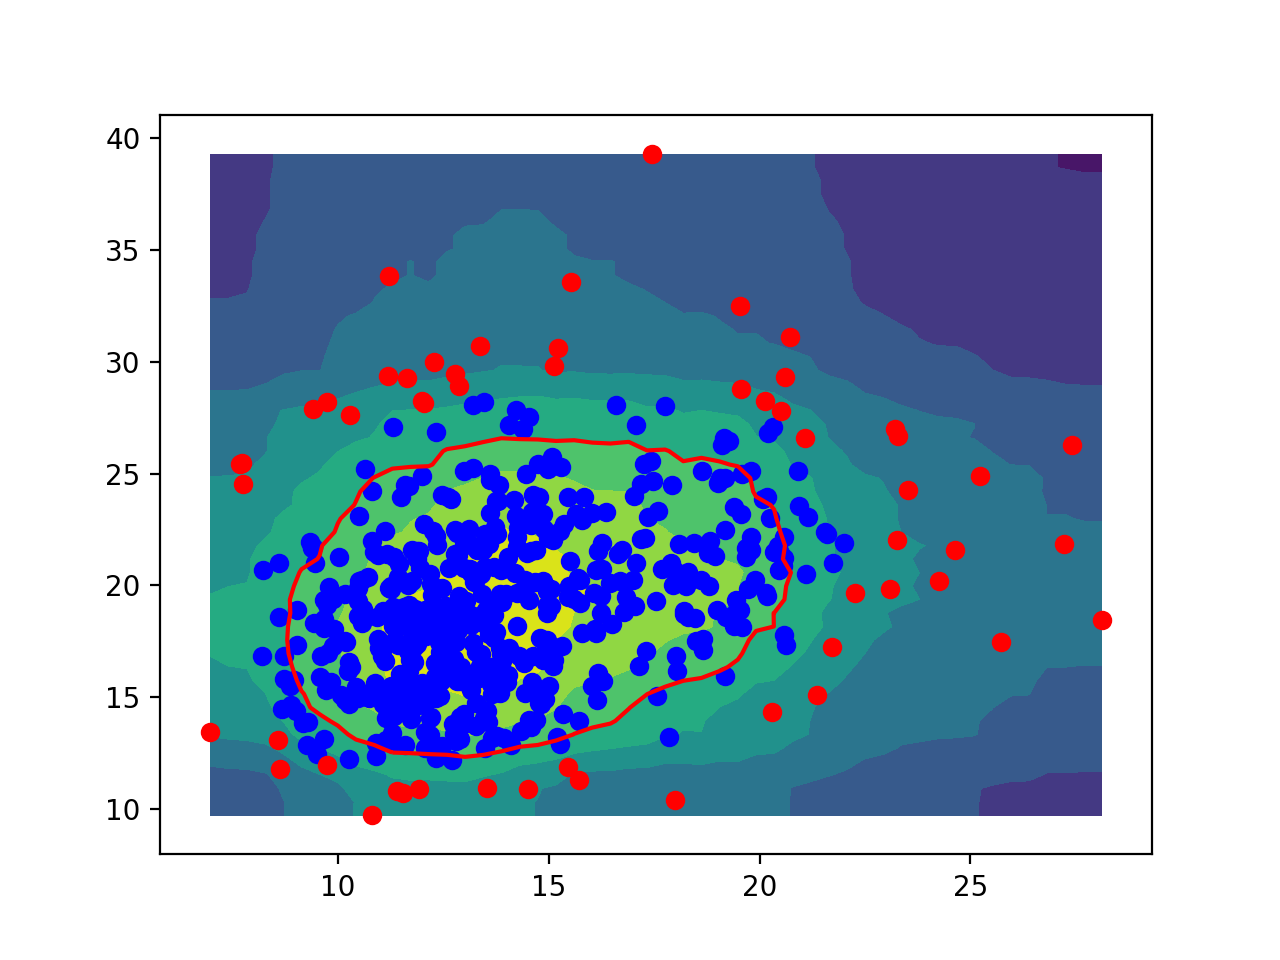
Isolation forest로 novelty detection을 한 결과는 다음과 같습니다.
참고 자료
- 강필성, 2018년 2학기 Business Analytics 강의 자료 3.Novelty Detection
- Ghafoori et al., 2016, Unsupervised Parameter Estimation for One-Class Support Vector Machines